Too much sets you back. Too little slows you down. What does the data show?
Claes Parflo
This is a personal account of one person's experience tracking health data through a health event. It is not medical advice, and it does not describe what any app or device can do for you. Individual experiences vary.
After the pulsed field ablation (PFA) on 21 February 2026, the problem changed fundamentally.
Before it, the task was to capture and document what was happening. After it, the task was to navigate recovery in real time. The question was no longer "what is happening?" — it was "how much load is appropriate today?"
That question has a frustrating property: the feedback is delayed. You can do too much today and not know until tomorrow. And intuition — the sense of how you feel in a given moment — is a particularly unreliable guide during a recovery phase, because subjective experience and how your body is actually responding don't always align.
Cardiac rehabilitation has known for decades that appropriately dosed exercise improves recovery after many cardiac conditions. So the goal was never to rest until healed. It was to find the right dose, every day, as the dose itself kept moving.
So I extended the system. The analysis framework I had built for episode tracking was redesigned for recovery monitoring. Rather than identifying episodes, it now evaluated daily health state: resting heart rate patterns, HRV, sleep quality, exercise contribution to the signal, and stability over time. The same logic applied consistently every day, with the same definitions and the same evaluation criteria.
On 8 May 2026, a follow-up Holter confirmed the 90-day mark clean. That mattered because it turned the daily recovery signal into something more concrete: not a guarantee, but evidence that the system had stayed stable across the first recovery window.
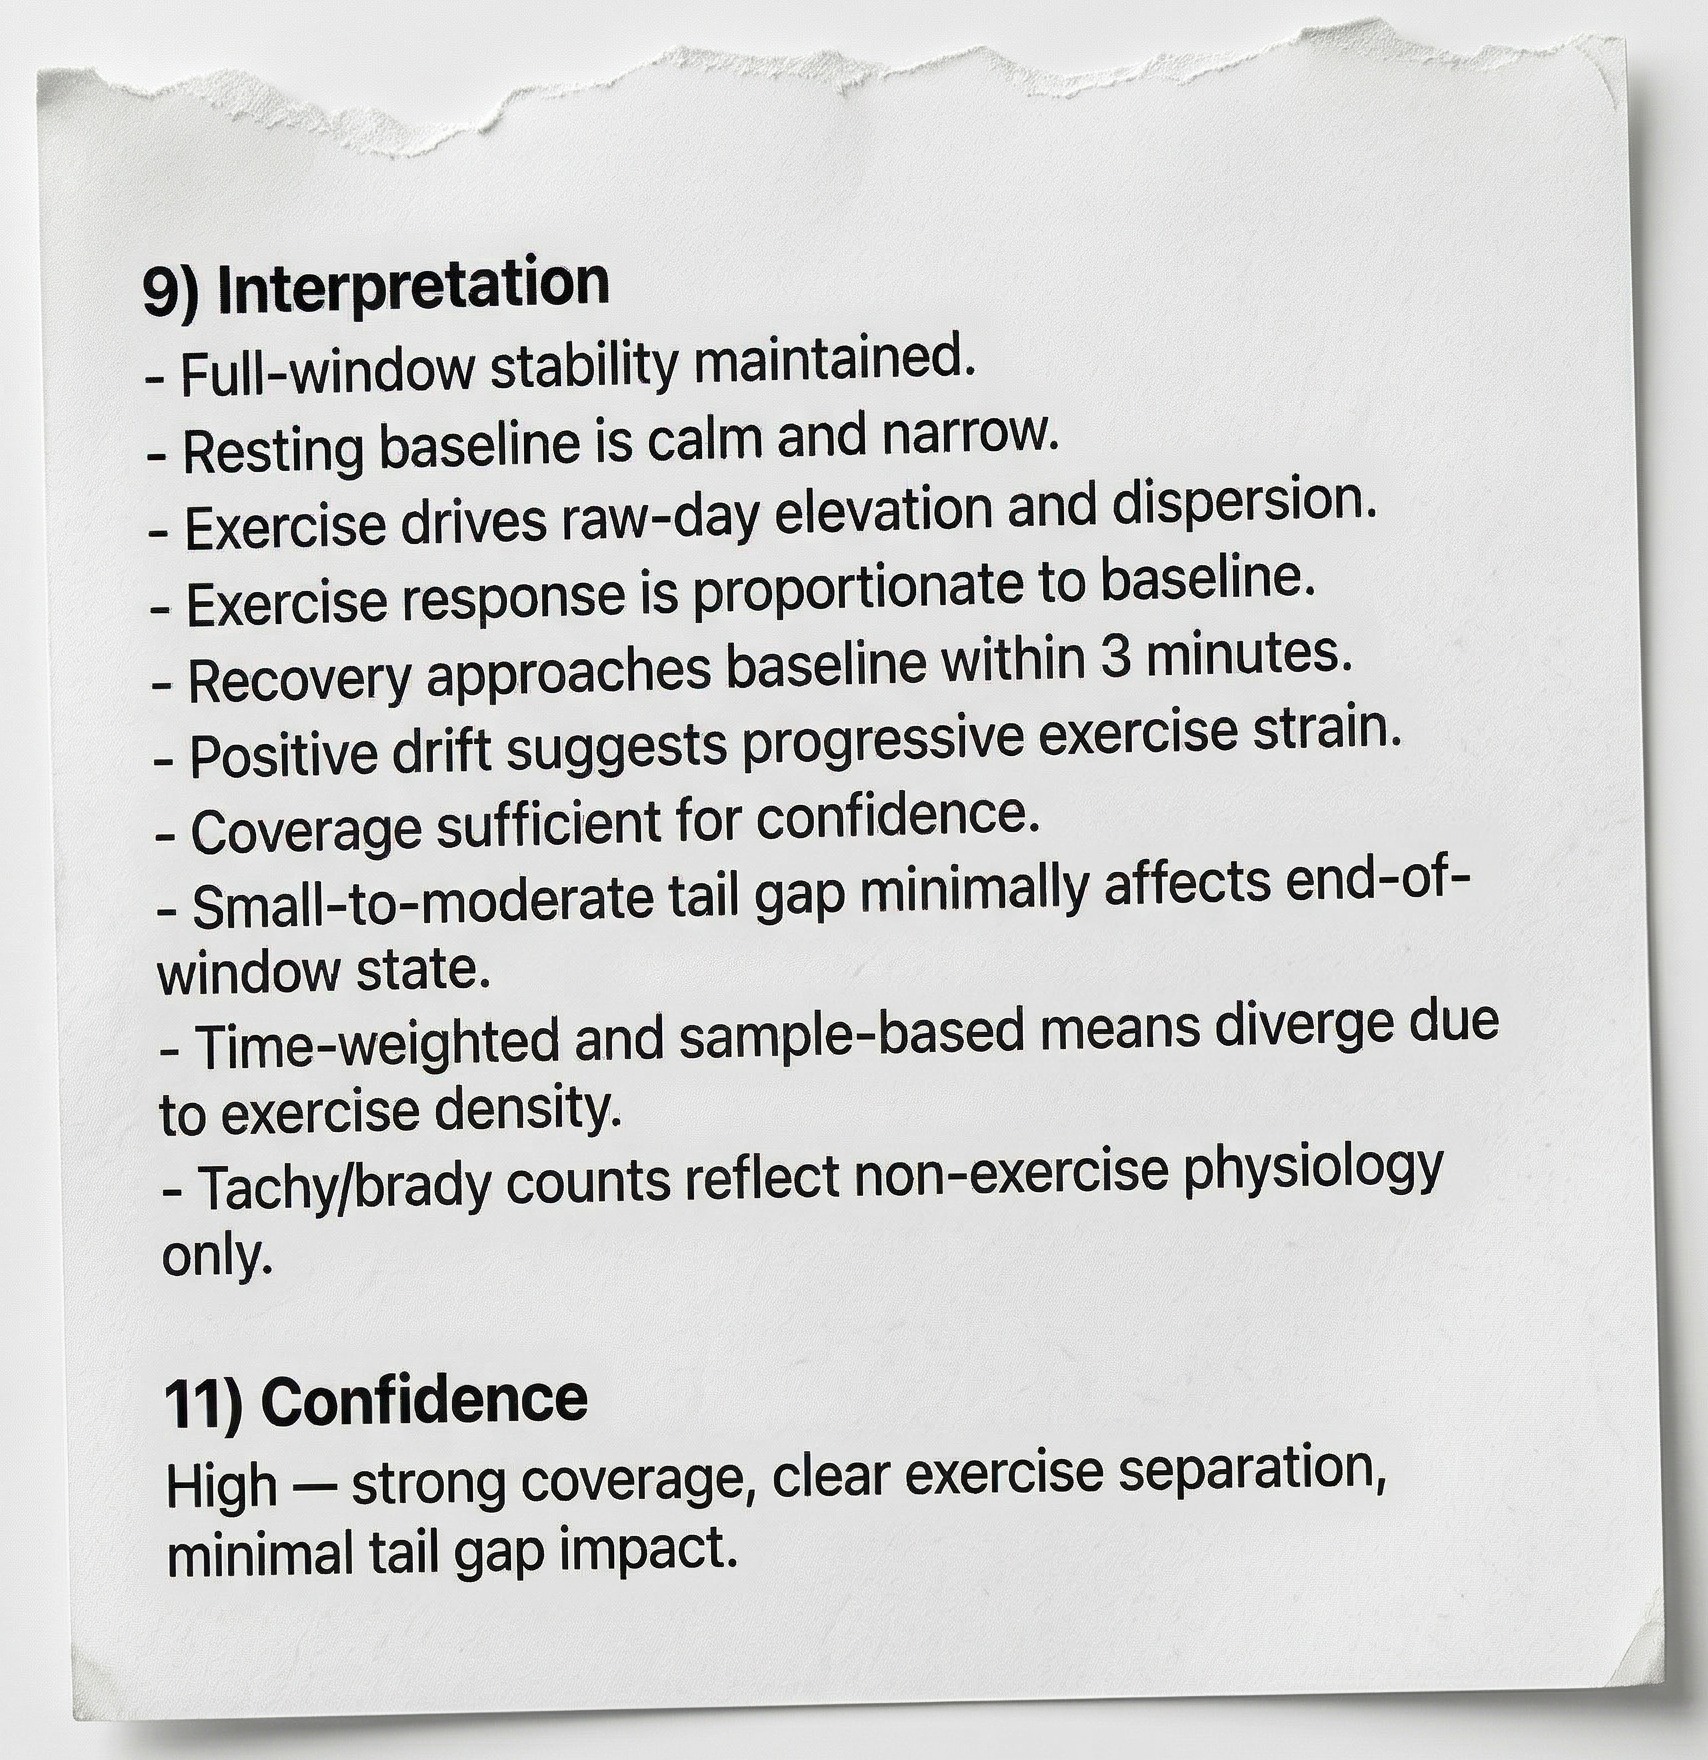
The core output of each daily analysis is a structured state description — not a score, not a recommendation, but a characterisation: whether the system is stable, whether there are signs of elevated load, whether recovery metrics are moving in the expected direction.
This distinction — between a score and a state description — matters more than it might seem. A score collapses information into a single number that implies a level of certainty the data doesn't support. A state description preserves uncertainty while still providing structure. It says: this is what the data shows, here is how it fits into the recent pattern, here is what would be worth watching.
Some days the analysis confirms that load can increase. Some days it flags that recovery hasn't completed and the appropriate response is to hold back. The value isn't that every call is correct. The value is that every call is made on the same basis, consistently, without selective interpretation.
From Signal to System